Summary
This is the fifth in a series of reports prepared in fulfillment of section 1245(d)(4)(A) of the National Defense Authorization Act (NDAA) for Fiscal Year 2012, as amended, which requires the U.S. Energy Information Administration (EIA) to submit to Congress a report on the availability and price of petroleum and petroleum products produced in countries other than Iran in the two-month period preceding the submission of the report. EIA consulted with the U.S. Department of the Treasury, the U.S. Department of State, and the intelligence community in the process of developing this report. Readers are encouraged to consult previous editions of this report for detailed background and contextual information not repeated here.
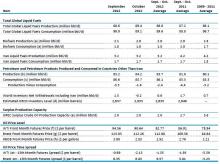
Estimates of production, consumption, surplus capacity and inventories
EIA estimates that global liquid fuels1 production in September and October 2012 averaged 89.0 million bbl/d, an increase of 1.8 million bbl/d2 from the same time period last year. Global liquid fuels consumption exceeded production slightly, resulting in a 0.6 million bbl/d draw in global oil stocks in September and October 2012 (Table 1 and Figure 1). Oil inventories in the United States fell by an average of 0.2 million bbl/d in September and October. Commercial inventories in other member states of the Organization for Economic Cooperation and Development (OECD) declined by an average of 0.1 million bbl/d over the same time period (Table 2). However, these 60-day averages mask divergences between two months, as the global supply-demand balance loosened in October despite stock withdrawals in the United States.
Global oil production increased by 0.8 million bbl/d in October compared to September. Production returned in some areas, including Canada, which had been undergoing regular maintenance. Furthermore, a number of unplanned outages eased in October, including the shut-in production volumes in the Gulf of Mexico in the wake of Hurricane Isaac. Hurricane Isaac led to a peak shut-in of 1.3 million bbl/d of U.S. production in the Gulf of Mexico, and average disruption volumes of 210 thousand bbl/d in August and September.
Total consumption decreased month-over-month by an estimated 0.9 million bbl/d in October, mainly due to estimated falls in consumption in Europe by 0.4 million bbl/d, China by 0.2 million bbl/d, and other non-OECD countries by 0.4 million bb/d. The consumption decline in Europe and non-OECD countries are mainly due to seasonal factors. The Middle East accounted for a majority of the consumption decline in non-OECD countries, as demand for oil-fired electricity generation waned as cooling needs fell along with temperatures. China has been experiencing a slowing of its economic growth rate, which likely contributed to its decrease in consumption.
In the United States, October is typically the time when attention shifts from transportation to heating fuels. In contrast to estimates of falling consumption in other markets, preliminary estimates suggest that U.S. consumption slightly increased month-over-month by 0.2 million bbl/d in October, after dropping by 0.6 million bbl/d between August and September. Historically, September represents a trough in the seasonal patterns of U.S. oil consumption, as the summer driving season ends and mild temperatures limit heating oil demand, which becomes more pronounced in October.
Going into the heating oil season, global distillate markets are relatively tight, as reflected in both futures market prices and inventory levels in the United States. While U.S. distillate production is high, the global supply-demand balance for distillate fuels has created a price structure that has not encouraged inventory builds, as prices for future delivery are below current prices. The low distillate inventories could contribute to heating oil price volatility this winter. In addition, outages at several major refineries, notably Petroleos de Venezuela's Amuay Refinery, Shell Oil's Pernis Refinery in the Netherlands, and Irving Oil's Saint John Refinery in Canada, have added to market pressures in the Atlantic Basin.
In September and October 2012, EIA estimates that consumption of petroleum and petroleum products in countries other than Iran averaged 86.1 million bbl/d. During the same period, EIA estimates that production of petroleum and petroleum products in countries other than Iran averaged 83.7 million bbl/d, which is 3.7 million bbl/d or almost 5 percent higher than the three-year annual average from 2009-2011 (Table 1). The increase in global production compared with the three-year average can be attributed largely to a combination of increased output from some OPEC members and continued growth in North American oil supply. For example, average total liquid fuels supply in September and October 2012 in the United States is up by 1.3 million bbl/d, or almost 14 percent, from the three-year annual average from 2009-2011. Tables 3 and 4 provide further country-level reporting on supply estimates.
Most of the growth in OPEC supply in 2012 relative to last year derives from Iraq, Libya, and Saudi Arabia, with smaller growth in Kuwait and United Arab Emirates. Iraq's estimated average production level of 3.2 million bbl/d in September and October showed an increase over the preceding two months, boosted by new infrastructure and arrangements that have facilitated increased exports from its large southern fields and the area controlled by the Kurdistan Regional Government. Libyan crude oil production rose to approximately 1.5 million bbl/d in September and October from an average of 1.4 million bbl/d in July and August, slowly approaching the pre-crisis level of 1.65 million bbl/d even as the attacks on American personnel in Benghazi served as a tragic reminder that insecurity continues to plague the country. Meanwhile, Saudi Arabia continued to produce at relatively high levels, about 1.0 million bbl/d more than its three-year average (Table 4). Nigerian oil production declined to about 2.1 million bbl/d in September and October from an average of 2.2 million bbl/d in July and August. Production declined in September due to maintenance-related outages, and remained relatively flat in October as flooding affected some onshore production.
Non-OPEC liquids production in September and October 2012 is estimated to be 0.4 million bbl/d above last year's level. The United States is the largest source of non-OPEC liquids production growth over the past year and the largest source of liquids production growth relative to the recent three-year average for any country. Due to the continued production growth in onshore tight oil plays, U.S. crude oil production averaged 6.5 million bbl/d in September and October, as total liquids production reached 11.0 million bbl/d. Many of the other countries that are producing above three-year averages are also located in the Western Hemisphere, including Canada, Brazil, and Colombia. Russia and China also produced above their three-year levels, although the increases in these two countries were relatively smaller at about 0.2 million bbl/d (Table 3).
Unplanned non-OPEC disruptions declined slightly over the last month, from an average of about 1.1 million bbl/d in both August and September to 0.9 million bbl/d in October. This is mainly due to the return of U.S. production in the Gulf of Mexico, which was temporarily affected by Hurricane Isaac in August and September (Figure 2). An above-normal volume of non-OPEC production is offline due to unrest and an embargo in Syria. The situation in Syria continues to deteriorate and its impact on oil prices arguably transcend disrupted volumes in that country as concerns grow about the risk of regional spillover effects from the conflict. Production in South Sudan is still completely offline, though the government has recently ordered oil companies to restart production, shortly after reaching an agreement with Sudan on oil export fees and security arrangements. However, some post-independence issues such as border demarcation, rights to the disputed Abyei region, and claims for compensation of seized assets still remain unresolved.
EIA estimates that global surplus crude oil production capacity was 2.0 million bbl/d in September and October (Table 1). This estimate does not include additional capacity that may be available in Iran, but which is currently offline due to the impacts of U.S. and EU sanctions on Iran's ability to sell its oil. The current level of surplus capacity is quite modest by historical standards (e.g., 3.6 million bbl/d average from 2009 to 2011 and 2.7 million bbl/d average in September and October 2011), especially when measured as a percentage of global oil production and consumption. Surplus capacity must also be considered in the context of current geopolitical uncertainties, including, but not limited to, the situation in Iran.
During September and October, EIA estimates that liquid fuels production and consumption in Iran were 3.2 million bbl/d and 1.7 million bbl/d, respectively (Table 1). The difference between the preliminary estimates of Iran's liquid production and consumption levels includes Iran's implied net exports of crude oil, condensate, petroleum products, and natural gas liquids, as well as volumes slated for onshore and floating storage. Iran's crude oil production capacity has eroded in recent years, due to its inability to carry out investment projects that are necessary to offset the natural decline in production from existing wells. Iranian crude oil production continued to decline in September and October, albeit at a slower pace than this past summer when month-over-month declines reached their highest levels around the entry into force of U.S. and EU sanctions. EIA estimates that Iran's total liquids production has fallen to about 3.2 million bbl/d in September and October 2012 compared with the year-ago average of 4.2 million bbl/d.
A number of recently published reports indicate that Iranian crude oil exports experienced precipitous declines in July, due to the enforcement of the latest round of U.S. and EU sanctions, although Iran's difficulties in exporting its oil seemed to have eased somewhat in September and October. While countries in the EU appear to have ceased imports of Iranian crude oil, the reinsurance ban imposed by the EU affected Iran's ability to sell its crude to some of its largest customers in Asia, including Japan and South Korea. Most of Iran's crude oil customers have been able to replace insurance coverage, once provided by European protection and indemnity (P&I) clubs, over the last two months. Preliminary data show a very small increase in global imports of Iranian crude oil since July. EIA bases this assessment on preliminary commercial data on tanker liftings from Iran, press reports, and other relevant information. This tentative interpretation of a very fluid situation could change as data are revised and more details emerge.
Crude oil and petroleum product prices
In contrast to data on petroleum and petroleum product volumes, price data is available on a real-time or near-real-time basis3. Over the last 60 days, crude oil prices have declined (Figure 3). For the five days ending on October 23, the price of the front-month futures contract for Brent crude from the North Sea, a proxy for the global oil price, averaged $110.69 per barrel, a $3.68 per barrel decrease from its average over the August 20—24 period when the last report was released.
Despite the recent price declines, crude oil prices are currently higher than their year-ago averages. The average price for September and October of the front month West Texas Intermediate (WTI) contract was $92.77 per barrel and the two-month average for the Brent front month contract was $112.68 per barrel (Table 5). The September and October average prices were $6.76 and $3.32 per barrel higher than at this time a year ago for WTI and Brent and $13.83 and $28.04 per barrel higher than the three-year average from 2009 to 2011, respectively.
The Brent market has remained in backwardation, with prompt month prices above prices for future delivery, during all of September and October. For the five-days ending October 23, the 1st — 13th month spread averaged slightly above $6 per barrel, well above the 2012 lows of -$1.17 for the five-day period ending June 26 and a slight increase from the five-day period ending on August 24. One possible contributor to the recent backwardation in the Brent market may be related to the reduced shipping volumes of crude oil out of the North Sea. September showed the lowest amount of crude oil loadings from the North Sea in over five years and there are reports that some of the maintenance and production issues have carried over into October as well. With those reduced volumes, front month prices increased relative to prices further out on the futures curve to incentivize selling out of inventories.
The WTI 1st — 13th month spread has remained in contango, averaging -$1.35 per barrel in September and October, but this is a much smaller spread than the three-year average of -$5.59 per barrel from 2009 through 2011. WTI prices continue to reflect transportation bottlenecks in the midcontinent region with crude oil inventories at Cushing, Oklahoma, the delivery point for the WTI futures contract, well above their five-year averages. Efforts to reconfigure existing pipelines and build new ones are ongoing in order to ameliorate the excess of crude oil in the U.S. midcontinent.
For the five days ending October 23, the average price of the January 2013 WTI crude oil futures contract was $90.70 per barrel and the average price of the January 2013 Brent contract was $109.97 per barrel. WTI average prices for the five days ending October 23 for the January 2013 contract have decreased by about $6.95 per barrel since August 24 and Brent prices have decreased by $2.84 per barrel over the same time period. Based on implied volatilities calculated from options and futures prices over the five days ending October 23, the probability of the January 2013 WTI futures contract expiring above $100 per barrel is 19 percent, a decrease of 22 percentage points from the same calculation made using price data from the five-day period ending August 24. Given the higher absolute level of Brent prices relative to WTI prices over the last two months, the probabilities that the January Brent contract will exceed specified dollar thresholds are higher.
Reformulated blendstock for oxygenate blending (RBOB) is a widely traded unfinished gasoline that requires blending with an oxygenate, such as ethanol, before being sold. RBOB prices declined along with crude oil prices over the last two months. Comparing the five-day periods ending August 24, 2012 and October 23, the price of the front month of the NYMEX RBOB contract, which calls for delivery in New York Harbor, decreased from $3.08 per gallon to $2.70 per gallon. Some of this decrease is attributable to the switchover from summer-grade gasoline to cheaper winter-grade gasoline. During September and October, the average price for the front month RBOB futures contract was $2.92 per gallon, $0.71 per gallon higher than the average front month price over the three-year period from 2009-2011 and $0.22 per gallon above the September and October 2011 average.
The average price of the January 2013 RBOB futures contract for the five-day period ending October 23 was $2.67 per gallon, a decrease of $0.11 per gallon since August 24. Based on implied volatilities calculated from options and futures prices over the five days ending October 23, the probability of the January 2013 RBOB futures contract expiring above $3.35 per gallon (comparable to a $4.00 per gallon national average retail price for regular grade gasoline) is now 4 percent, an 8 percentage point decrease from August 24. The decreased gasoline futures prices were largely responsible for the lower probability of retail gasoline exceeding different price points.
Table Note: The term "liquid fuels" encompasses crude oil, lease condensate, natural gas plant liquids, biofuels, coal-to-liquids, gas-to-liquids, and refinery processing gains, which are important to consider in concert due to the inter-related supply, demand, and price dynamics of petroleum, petroleum products, and related fuels.
(a) Biofuels production and consumption are based on EIA estimates for 2010 as published in the International Energy Statistics. Biofuels production in July and August tends to be at its highest level in the year since ethanol production in Brazil reaches its seasonal peak in the third quarter.
(b) Production includes crude oil (including lease condensates), natural gas plant liquids, other liquids, and refinery processing gains.
(c) Consumption of petroleum by the OECD countries is synonymous with "products supplied," defined in the glossary of the EIA Petroleum Supply Monthly, DOE/EIA-0109. Consumption of petroleum by the non-OECD countries is "apparent consumption," which includes internal consumption, refinery fuel and loss, and bunkering.
(d) Estimated inventory level is for OECD only.
(e) EIA defines surplus oil production capacity as potential oil production that could be brought online within 30 days and sustained for at least 90 days, consistent with sound business practices. This does not include oil production increases that could not be sustained without degrading the future production capacity of a field.
(f)WTI refers to West Texas Intermediate crude oil traded on the Chicago Mercantile Exchange (CME).
(g) Brent refers to Brent crude oil traded on the Intercontinental Exchange (ICE). (h) RBOB refers to reformulated blendstock for oxygenate blending traded on the CME.
Table Note: October prices include data through market close on October 23, 2012.
Source: U.S. Energy Information Administration